So what's a guy to do with a screen 3x his laptop but play around some with Excel's pie chart creator? I mean, after using Office XP/03/04 for so long, 2010/2011 is practically fun to use.
I had been reading up a little bit about oil and budgeting and how speculation and sudden price changes impact personal finances, and there's nothing quite like seeing pie charts as big as your head. While I used to keep a detailed budget when first developing my own financial habits, after a few years now I'm comfortable in the gray(er) area of approximations and estimates. So in rough terms, I thought I'd try and match approximately what my budget looks like compared to the average household put together by John Lohman.
First, here's a snippet of the chart specifically on household expenditures:

I matched his categories and came up with this:

But that left me dissatisfied for a couple of reasons. First, 'other' is way too big a category. Second, this approach doesn't really help sort out what's variable and what's fixed. In other words, what could be changed easily, and what would require a radical departure from present living arrangements?
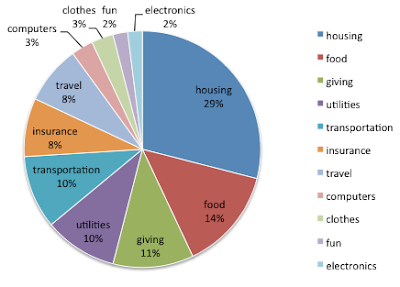
So a little more playing around in Excel led me to this:

It still has the Big One - housing - and it still has a few small categories of 2 or 3 percent. The improvement is there are now half a dozen categories of in between size that show how my personal expenditures might be changed were a sudden shock to occur. Changing the thermostat is a different degree of change than changing the address. Not traveling to Florida or Washington is a different degree of change than not having a car to drive to the grocery store and not ever going out to see a movie.
I would also use it as a reminder that things like oil shocks and peak oil aren't as big a problem as they are often hyped to be. We possess a variety of simple adaptations which would rapidly become widespread substitutes were there to be serious limitation on our access to cheap oil. Some of these are so mundane, like carpooling, telecommuting, four day workweeks, and bicycling, that we don't even think about them when contemplating high-tech solutions for the 21st century. Others involve a repricing of resources - like increasing the value of abandoned urban property relative to far flung suburban developments - while still others require more centralized, long-term planning, but they're well established technologies, like rail travel. It wasn't cheap oil that helped the Noth in the Civil War or enabled the original ecotourism of the National Parks. It was cheap transportation, and amidst all the fearmongering about the future, don't forget those are two different concepts.
Cheap oil won't last forever, no. But we have plenty of alternatives. Some of them are even improvements on how development has occurred over the past half century.
But of course, we're nowhere near that stage. Oil isn't getting more expensive for companies like ExxonMobil and ConocoPhillips. They're simply making larger profits. Funny what happens when you follow the money.
Or for one last chart, here's the war budget (just Overseas Contingency Operations, not the 'regular' security spending, which is 4x larger) next to the Amtrak budget:

No comments:
Post a Comment